U.S Dollar Index - What is the next target in 2018?
Click to enlarge: https://s.tradingview.com/x/EPbiUY5b/
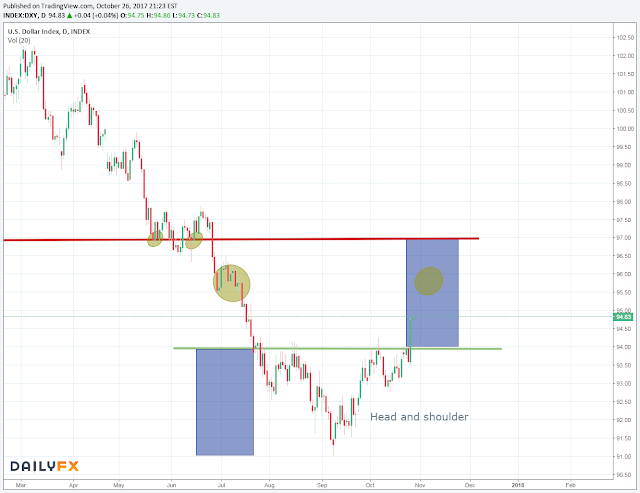
It is worth to point out that DXY has been forming head and shoulder in the last three months. An important neckline is around 94 (green line). We can see it has been acted as resistance for U.S. dollar on daily chart for a while and a break out will lead to next two resistance level:
i. 95.5 - 96 level, by observe the consolidation in Jul 2017
ii. 97 level, the red line has been the pivot support area
One important justification for above levels is the H&S projection target. The whole H&S formation has a 300 pips range (91 - 94). Carrying on the bull momentum to 94s level, we can easily project another 300 pips target in the coming 4 months.
Aforementioned finding is also match with our previous targets in USDJPY pair, which is the 118 level again in 2018 (USD/JPY - marco trading cycles and year projection). With the assistance from FOMC decision, it is a possible target for the interest rate cycle.
For more analysis and researches, please follow: AMMOSIGNALS


Comments
Post a Comment